Time Series Analysis for Silicon Wafers
Application to the Chemical-Mechanical Polishing Process
Project Details
- Category: Data Science
- Language: C and Python
- Date: December 2022
- Mark: 18/20
- GitHub: Project Repository
- Project Report (in French)
- Project Beamer (in French)
This project is a collaborative work between Kawtar El Mamoun and myself. Our objective was to develop an application in C, which allows preprocessing the given time series to predict and better explain the evolution of the target characteristic (i.e., the average rate of surface material removal) using historical data. What makes this project unique is the fact that we managed to code it entirely in a single night.
Introduction
Let's consider the dataset provided as part of a competition organized in 2016 by the PHM1 company, which focused on predicting the average rate of surface material removal from semiconductor wafers through a chemical reaction. The entire data set was collected during the chemical-mechanical polishing (CMP) of surfaces, which is a standard manufacturing process in the semiconductor industry. To predict the average rate of surface material removal, 18 univariate time series associated with the evolution of health indicators specific to a CMP system are provided.
The complete description of the dataset is available here.
Objectives
The objective of this project is to develop an application in C, which allows pre-processing of the given time series data in order to predict and better explain the evolution of the target characteristic (i.e., the average rate of surface material removal) using historical data. It involves developing the following functionalities:
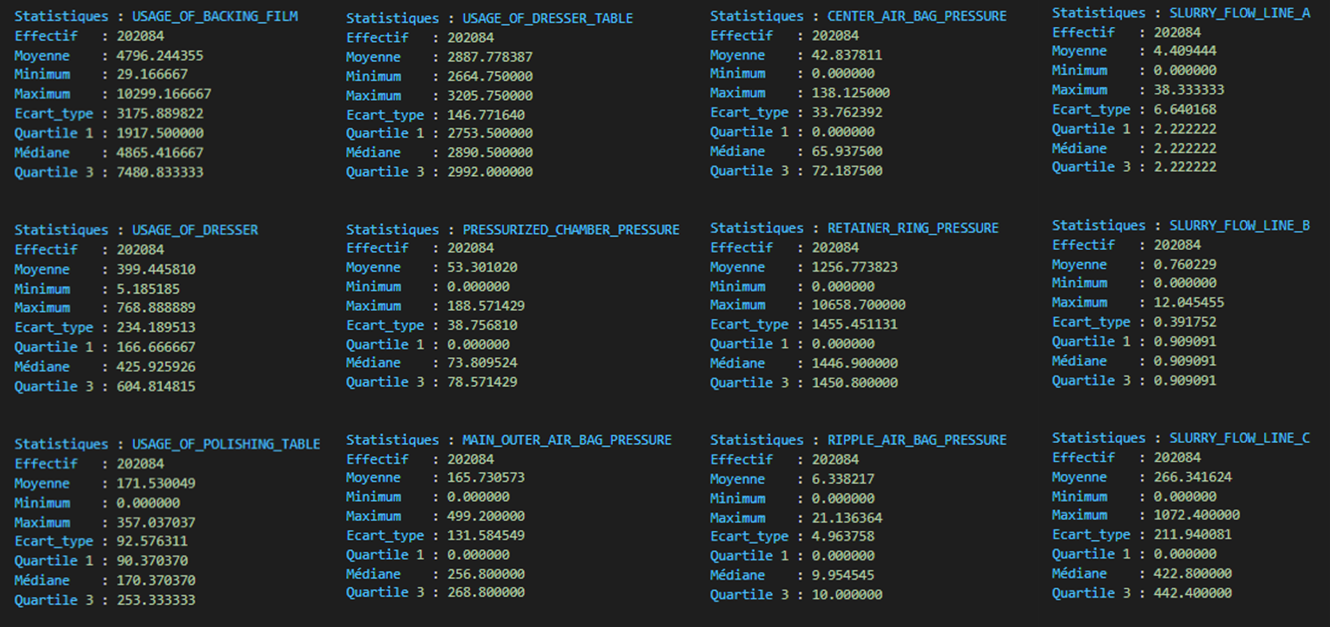
Central and dispersion descriptive statistics
For each time series, calculate the following descriptive statistics: mean, min, max, standard deviation, median, quartiles. Export these statistics to a text file.
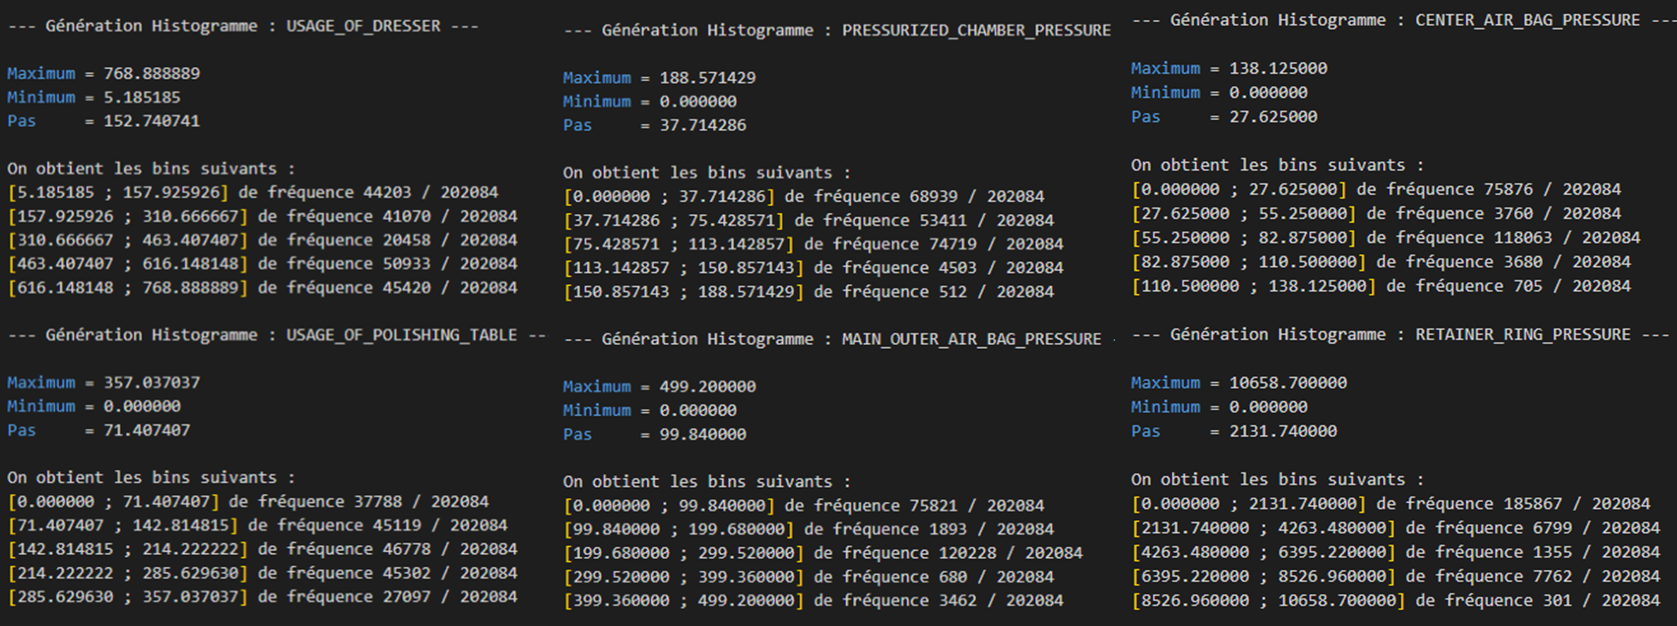
Detection of atypical observations
For each time series, detect and remove atypical observations by applying the kσ rule (where σ represents the standard deviation), which consists of removing observations whose value is greater (resp. lower) than kσ (resp. -kσ), k = {2, 3}.
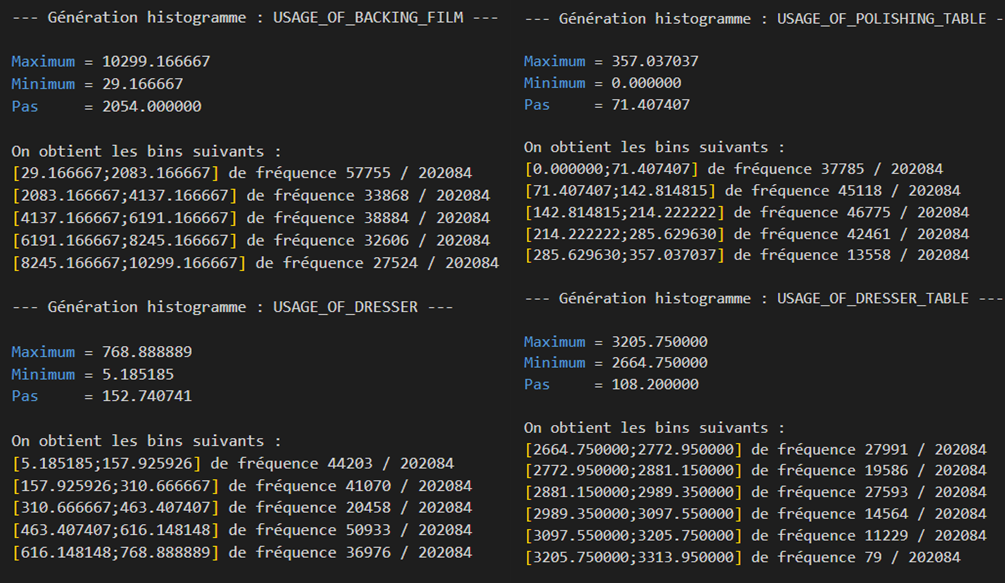
We also wrote a Python script in order to be able to visualize our results:
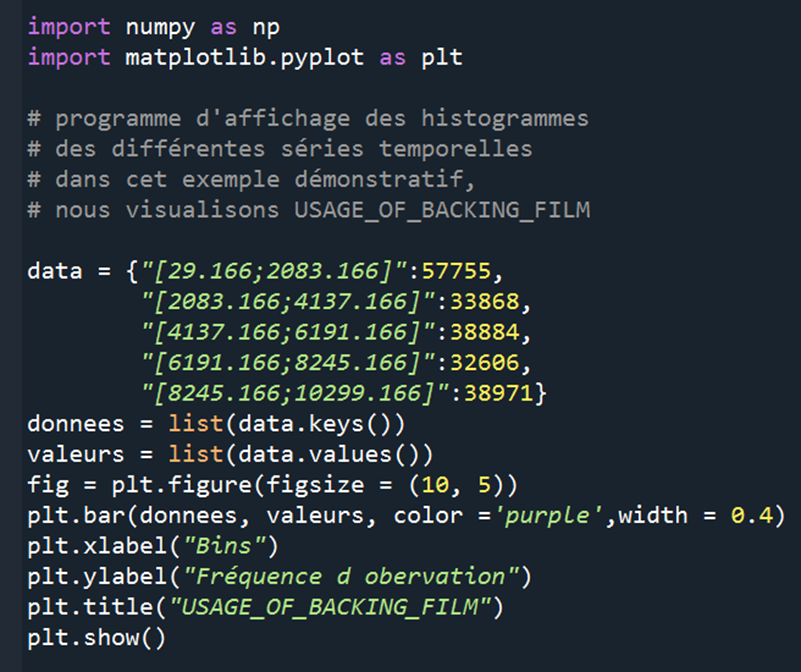
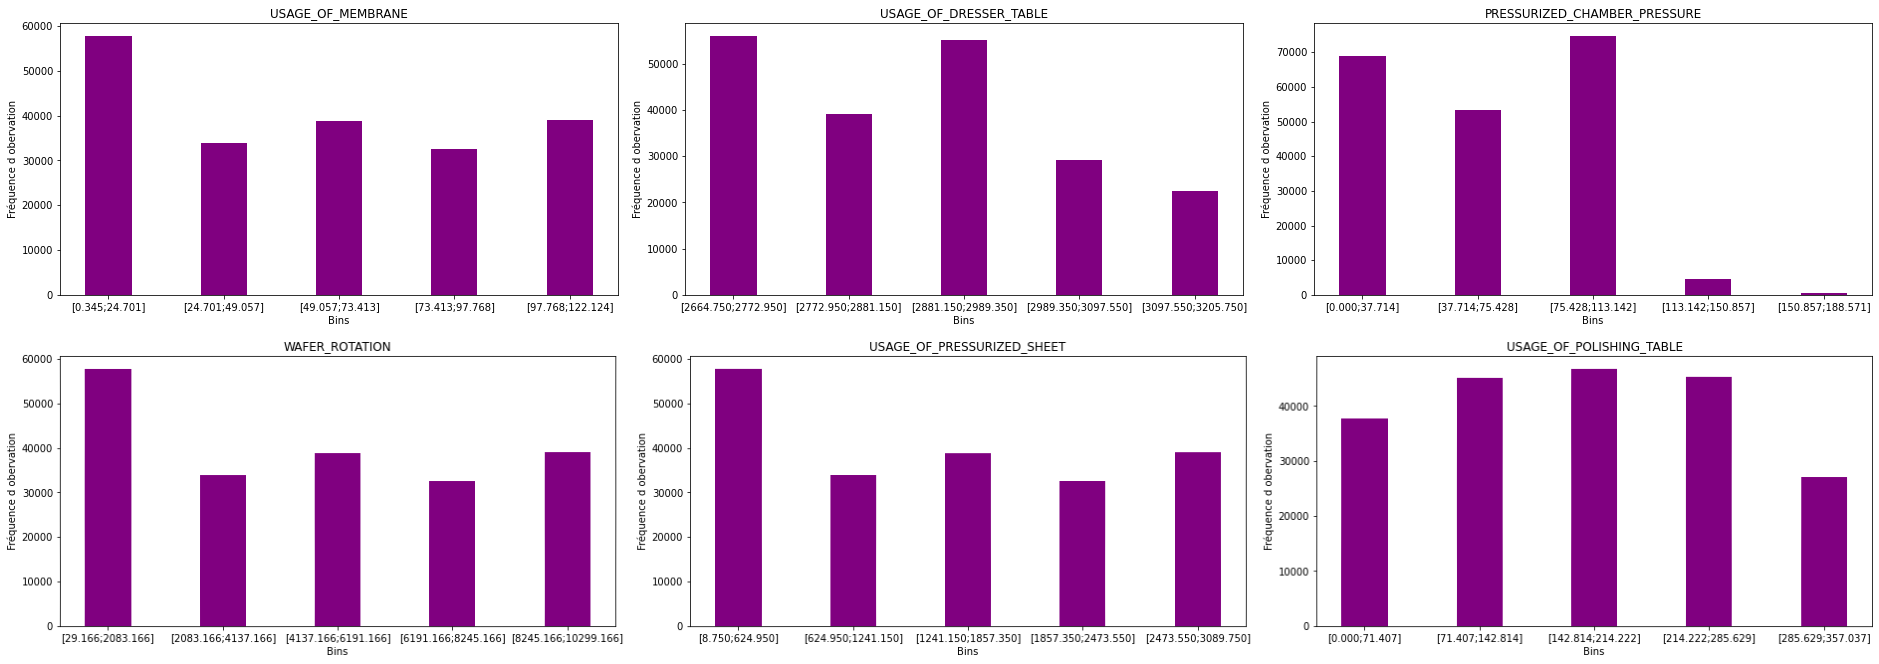
When we apply the kσ rule (question 2), the results change slightly:
Extraction of aggregated characteristics by wafer
For this question, we first concatenated the 58 files of the dataset thanks to our concat() function that you can find in the folder attached to this report. Then, we grouped all the WAFER_ID as the statement requests. Since the imposed correlation criterion is the mean, we will calculate, for each wafer, the means of each time series.
Thus, our function regrouper_wafer1() creates a file containing the WAFER_ID to find redundancies and repetitions. Then, the output of this function is given as input to regrouper_wafer2() which returns a file containing unique WAFER_IDs and a table containing the number of occurrences of each ID in the concatenated file. Then, our function tronquer() truncates the agregation_unique.csv file to perform averages on the wafers.
The comments have been arranged on the code to make it as clear as possible, and the main() function, located at the very end of the main.c file, contains the instructions to answer questions 1 to 4 by removing comments.